pprof火焰图分析利器之压测
字数:
140
·
阅读:
1 分钟
·
访问:
-
Benchmark
新建测试文件
util.go文件
func GetMd5V(s string) string {
	h := md5.New()
	h.Write([]byte(s))
	return hex.EncodeToString(h.Sum(nil))
}

func SumMd5(s string) string {
	data := []byte(s)
	return fmt.Sprintf("%x", md5.Sum(data))
}
以_test结尾的文件, 如util_test.go
func BenchmarkSumMd5(b *testing.B) {
	for i := 0; i < b.N; i++ {
		SumMd5("1")
	}
}
func BenchmarkGetMd5V(b *testing.B) {
	for i := 0; i < b.N; i++ {
		GetMd5V("1")
	}
}
运行Benchmark函数
go test -bench="." -benchmem
输出结果
BenchmarkSumMd5-8        1719777               847 ns/op              64 B/op          3 allocs/op
BenchmarkGetMd5V-8       1861362               644 ns/op             184 B/op          5 allocs/op
PASS
ok      openapi/app/util        4.493s
- 第二列, 1719777, 1861362 代表执行的次数, 越高越好.
- ns/op 代表多少纳秒执行一次操作, 越低越好
- B/op 每次操作内存占用字节数, 越低越好
- allocs/op 每次操作内存分配次数, 越低越好
性能分析
go test -bench="." -cpuprofile=prof.out
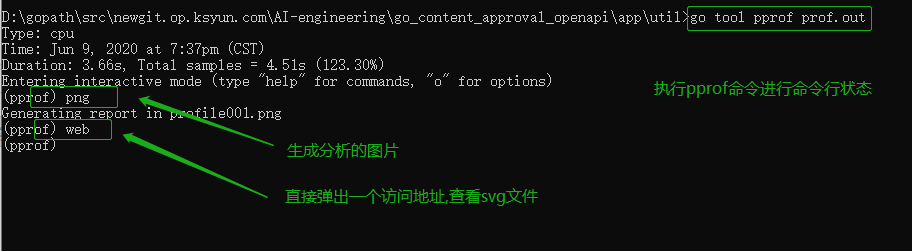
go tool pprof prof.out
-blockprofilerate n:goroutine 阻塞时候打点的纳秒数。默认不设置就相当于 -test.blockprofilerate=1,每一纳秒都打点记录一下。-coverprofile cover.out:在所有测试通过后,将覆盖概要文件写到文件中。设置过 -cover。-cpuprofile cpu.out:在退出之前,将一个 CPU 概要文件写入指定的文件。-memprofile mem.out:在所有测试通过后,将内存概要文件写到文件中。-memprofilerate n:开启更精确的内存配置。如果为 1,将会记录所有内存分配到 profile。
使用Graphviz分析性能
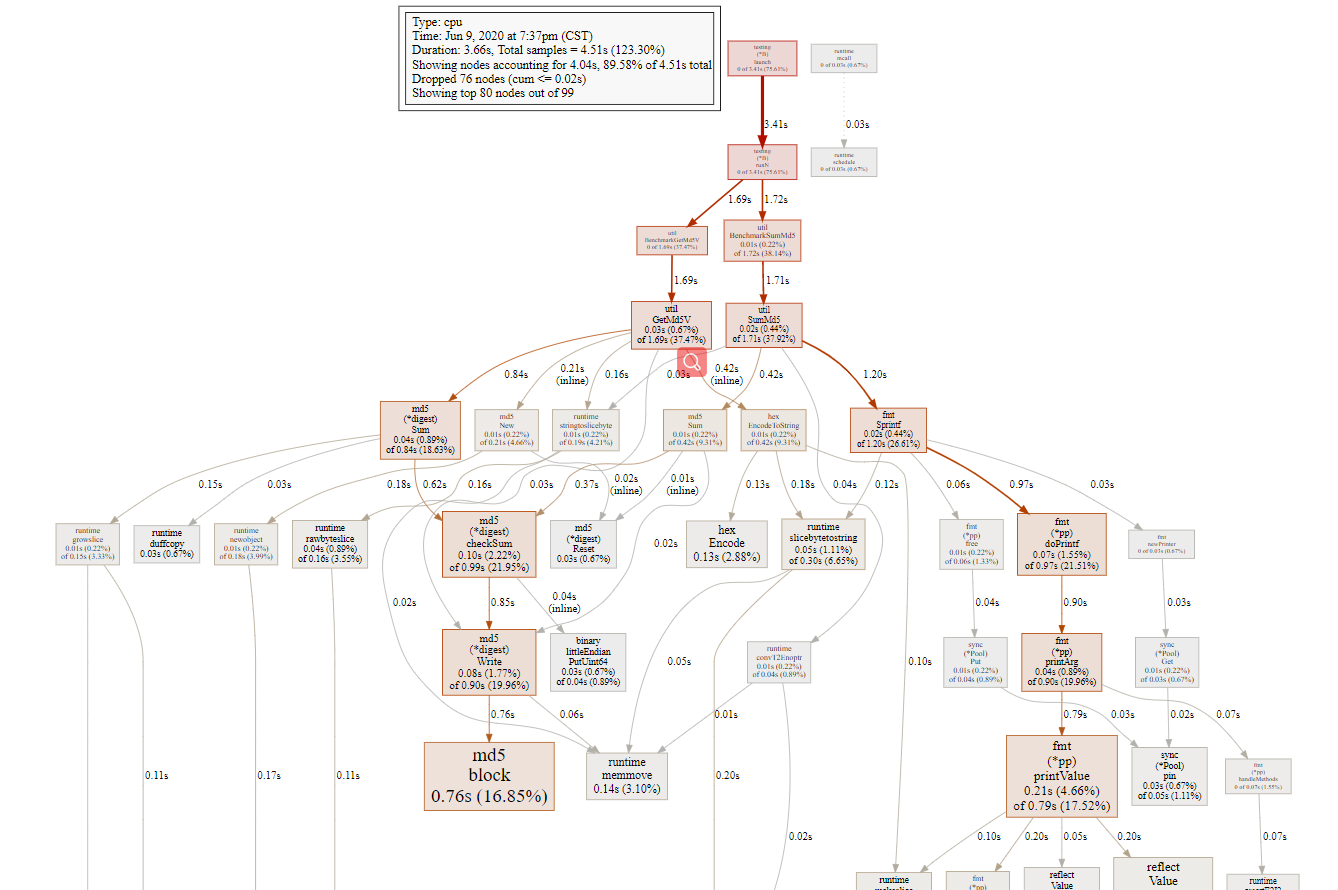
- 标红的矩形是cpu耗时最长的.
- 线最粗的同理.
- 显示时有耗时与占比.一目了然.分析利器