Filebeat 学习(二) 配置
字数:
494
·
阅读:
3 分钟
·
访问:
-
基于 filebeat 7.8.0
7filebeat 监听文件的变化, 进行记录文件位移, 从而实现不断读取数据,并收割数据并输送到指定终端或服务
配置
配置文件需要注意,分顶格写, - 表示数组, 缩进采用2个空格方式
输出控制台
监听文件夹下的所有
*.log文件, 并自定义字段, tags标识
cd /usr/local/filebeat

vim test.yml
# 输入配置
filebeat.inputs:
- type: log # 定义输入的类型, 可以是 stdin, log, tcp, udp, json
  enabled: true # 启动
  paths: # 文件路径, 可以是多个路径
    - /data/logs/tmp/*.log # 配置要监听读取的文件路径, *表示通配符
  tags: ["sgfoot"] # 自定义标签, 可以设置多个
  fields: # 自定义字段, 默认在 fields 节点下, 可以通过 fields_under_root = true 设置为跟节点
    www: sgfoot # 设置字段, key => value
  fields_under_root: false # true 为根目录, false 是在 fields 节点下.


# 输出配置
output.console:  # 输出到控制台上.用于测试
  enable: true # 启动
  pretty: true # 美化 json
启动 filebeat
- -e 将日志记录到标准日志并禁用系统日志/文件输出
- -c 指定你的配置文件,默认读取 filebeat.yml 文件
./filebeat -e -c test.yml
对/data/logs/tmp/目录写入新的文件
cd /data/logs/tmp
echo "hello_world" >> 1.log
控制台会监听到你的写文件,并输出如下格式的 json
{
  "@timestamp": "2020-07-25T09:50:40.018Z",
  "@metadata": {
    "beat": "filebeat",
    "type": "_doc",
    "version": "7.8.0"
  },
  "agent": {
    "id": "41dce2bd-fffa-4b4b-8c39-b871e397eaa2",
    "name": "VM_121_193_centos",
    "type": "filebeat",
    "version": "7.8.0",
    "hostname": "VM_121_193_centos",
    "ephemeral_id": "032fcead-90ca-490a-9b4a-106dcc931b15"
  },
  "log": {
    "offset": 9,
    "file": {
      "path": "/data/logs/tmp/1.log"
    }
  },
  "message": "11",
  "tags": [
    "sgfoot"
  ],
  "input": {
    "type": "log"
  },
  "fields": {
    "www": "sgfoot"
  },
  "ecs": {
    "version": "1.5.0"
  },
  "host": {
    "name": "VM_121_193_centos"
  }
}
通过设置这些字段, tags, fields, fields_under_root=false 我们能看到结果里包含啦.
  "message": "11",
  "tags": [
    "sgfoot"
  ],
  "fields": {
    "www": "sgfoot"
  },
输出到es
cd /usr/local/filebeat
vim es.yml
# input
filebeat.inputs:
- type: log
  enabled: true
  paths:
    - /data/logs/tmp/*.log
  tags: ["sgfoot"]
  fields:
    www: sgfoot
  fields_under_root: false

# output consle
#output.console:
 # pretty: true
 # enable: false

# set elasticsearch template setting
# 定义数据分配置的分片数量
setup.template.settings:
  index.number_of_shards: 1 # set shard number


# output elasticsearch
# 定义输出到 Es
output.elasticsearch:
  hosts: ["127.0.0.1:9200"] # 可以填写多个, ip:port格式
重启又启动filebeat
./filebeat -e -c es.yml
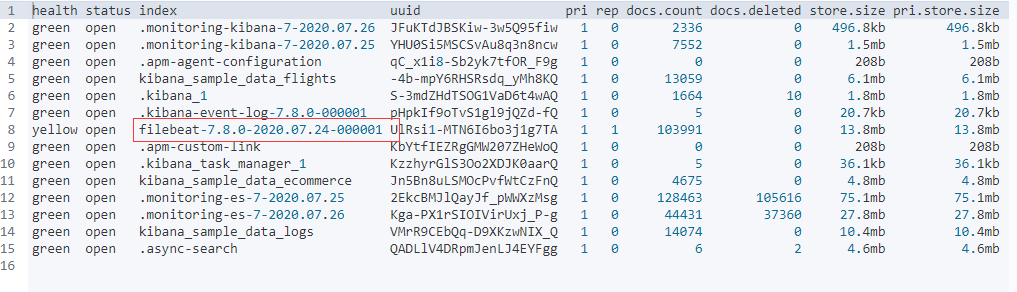
启完无误后, 数据就输出到es了. 我们在kibana的dev_tools里查看一下所有的索引.
GET _cat/indices?v
红线区就是filebeat创建的索引名称.
配置 modules
Module命令
# 查看所有的 module
./filebeat modules list
# 启动 nginx module
./filebeat modules enable nginx
# 禁用 nginx module
./filebeat modules disable nginx
配置 nginx module
./filebeat modules enable nginx
vim nginx.yml
# 设置 modules
filebeat.config.modules:
  # Glob pattern for configuration loading
  path: ${path.config}/modules.d/*.yml # 读取 module 文件

  # Set to true to enable config reloading
  reload.enabled: true

# set elasticsearch template setting
setup.template.settings:
  index.number_of_shards: 3 # set shard number
# output elasticsearch
output.elasticsearch:
  hosts: ["127.0.0.1:9200"]
进入 modules.d 文件夹, 配置 nginx
cd /usr/local/filebeat/modules.d
vim nginx.yml
# Module: nginx
# Docs: https://www.elastic.co/guide/en/beats/filebeat/7.8/filebeat-module-nginx.html

- module: nginx
  # Access logs
  access:
    enabled: true # 开启

    # Set custom paths for the log files. If left empty,
    # Filebeat will choose the paths depending on your OS.
    var.paths: ["/data/logs/nginx/access.log*"] # 配置日志的目录

  # Error logs # 读取错误日志文件
  error:
    enabled: true

    # Set custom paths for the log files. If left empty,
    # Filebeat will choose the paths depending on your OS.
    var.paths: ["/data/logs/nginx/error.log*"] #配置错误日志文件

  # Ingress-nginx controller logs. This is disabled by default. It could be used in Kubernetes environments to parse ingress-nginx logs
  ingress_controller:
    enabled: false

    # Set custom paths for the log files. If left empty,
    # Filebeat will choose the paths depending on your OS.
    #var.paths:
启动服务
./filebeat -e -c nginx.yml -d "publish"
启动参数
- -e 输出到标准输出,默认输出到syslog和logs下
- -c: 指定配置文件
- -d: 输出debug信息, publish 代表全部日志, 一般 用于调试