Prometheus: Grafana 监控 MySQL
字数:
171
·
阅读:
1 分钟
·
访问:
-
mysqld_exporter 安装
下载慢,请查看软件下载列表
https://prometheus.io/download/
cd /usr/local/src/
wget https://github.com/prometheus/mysqld_exporter/releases/download/v0.12.1/mysqld_exporter-0.12.1.darwin-amd64.tar.gz
tar -zxvf mysqld_exporter-0.12.1.darwin-amd64.tar.gz -C /usr/local/
mv /usr/local/mysqld_exporter-0.12.1.darwin-amd64 /usr/local/mysqld_exporter
创建 .my.cnf 文件
- host 主机地址
- user mysql名称
- password mysql密码
cat > /usr/local/mysqld_exporter/.my.cnf << EOF
[client]
host=127.0.0.1
user=root
password=root
EOF
创建 systemd 服务
cat > /lib/systemd/system/mysqld_exporter.service << EOF
[Unit]
Description=mysqld_exporter
Documentation=https://prometheus.io/
After=network.target

[Service]
Type=simple
User=root
ExecStart=/usr/local/mysqld_exporter/mysqld_exporter --config.my-cnf=/usr/local/mysqld_exporter/.my.cnf
KillMode=process
Restart=on-failure
RestartSec=10s

[Install]
WantedBy=multi-user.target
EOF
- 启动
systemctl daemon-reload
systemctl start mysqld_exporter
systemctl status mysqld_exporter
验证 metrics
显示有数据则表示已经采集到数据啦。
curl http://localhost:9104/metrics
添加到 prometheus 数据源
添加到 scrape_configs 节点上 job_name: ‘mysqld_exporter’
vim /usr/local/prometheus/prometheus.yml

scrape_configs:
  # The job name is added as a label `job=<job_name>` to any timeseries scraped from this config.
  - job_name: 'prometheus'

    # metrics_path defaults to '/metrics'
    # scheme defaults to 'http'.

    static_configs:
    - targets: ['localhost:9090']

  - job_name: 'mysqld_exporter' # mysqld_exporter 数据源。
    scrape_interval: 10s
    static_configs:
      - targets: ['localhost:9104']
使用 prometool 工具检查配置是否成功
./promtool check config prometheus.ymlChecking prometheus.yml SUCCESS: 0 rule files found重启 prometheus
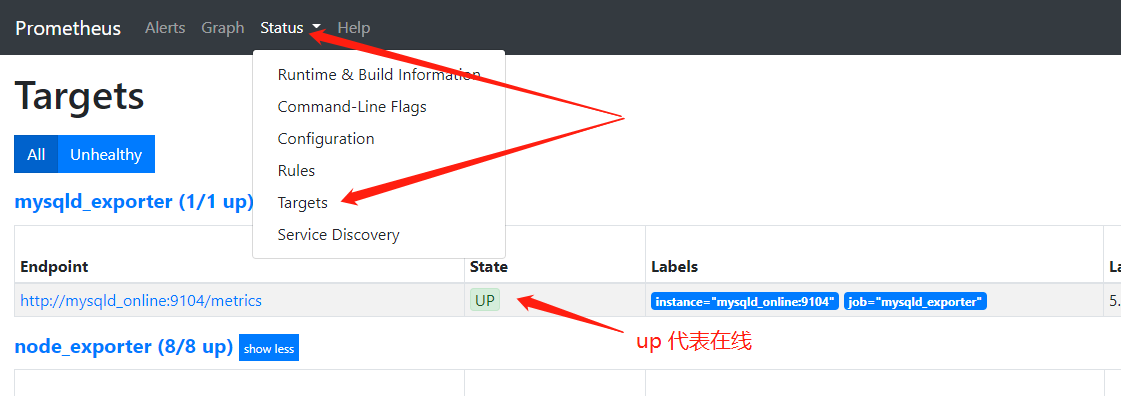
systemctl daemon-reload
systemctl restart prometheus
查看 prometheus 是否添加成功
http://127.0.0.1:9090/targets
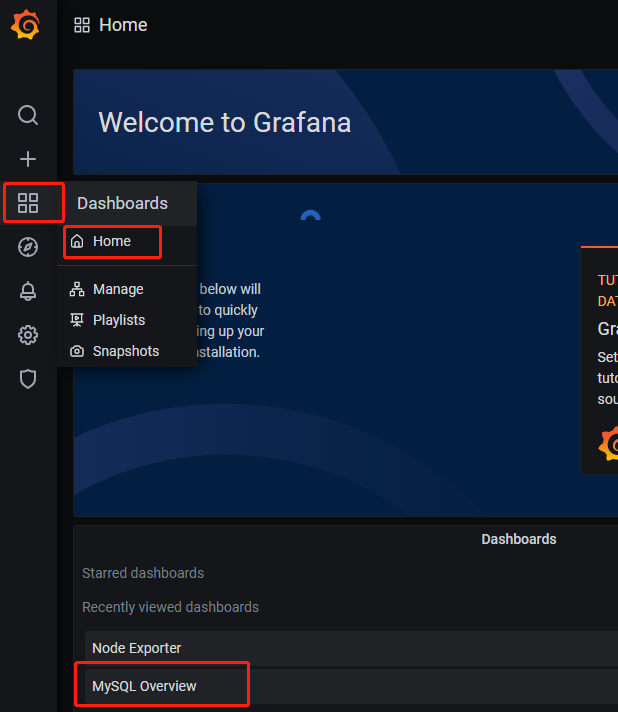
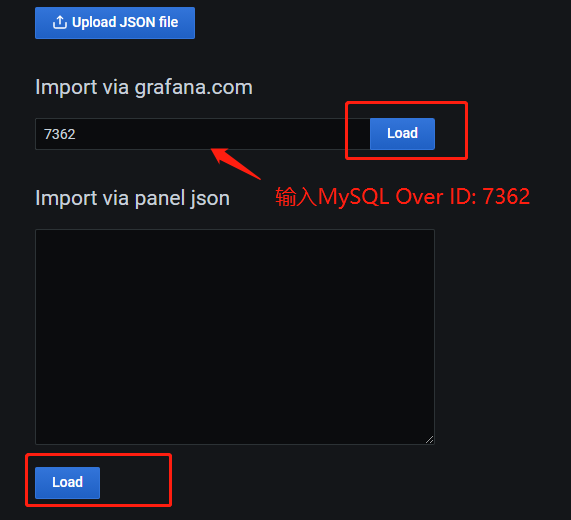
MySQL Over 图表安装
https://grafana.com/grafana/dashboards/7362
- 在 Grafana 导入 ID: 7362 添加图表
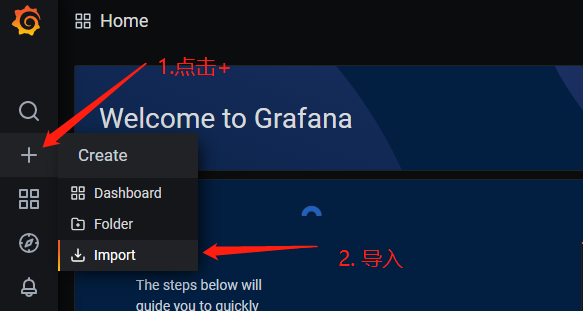
- Import ID: 7362
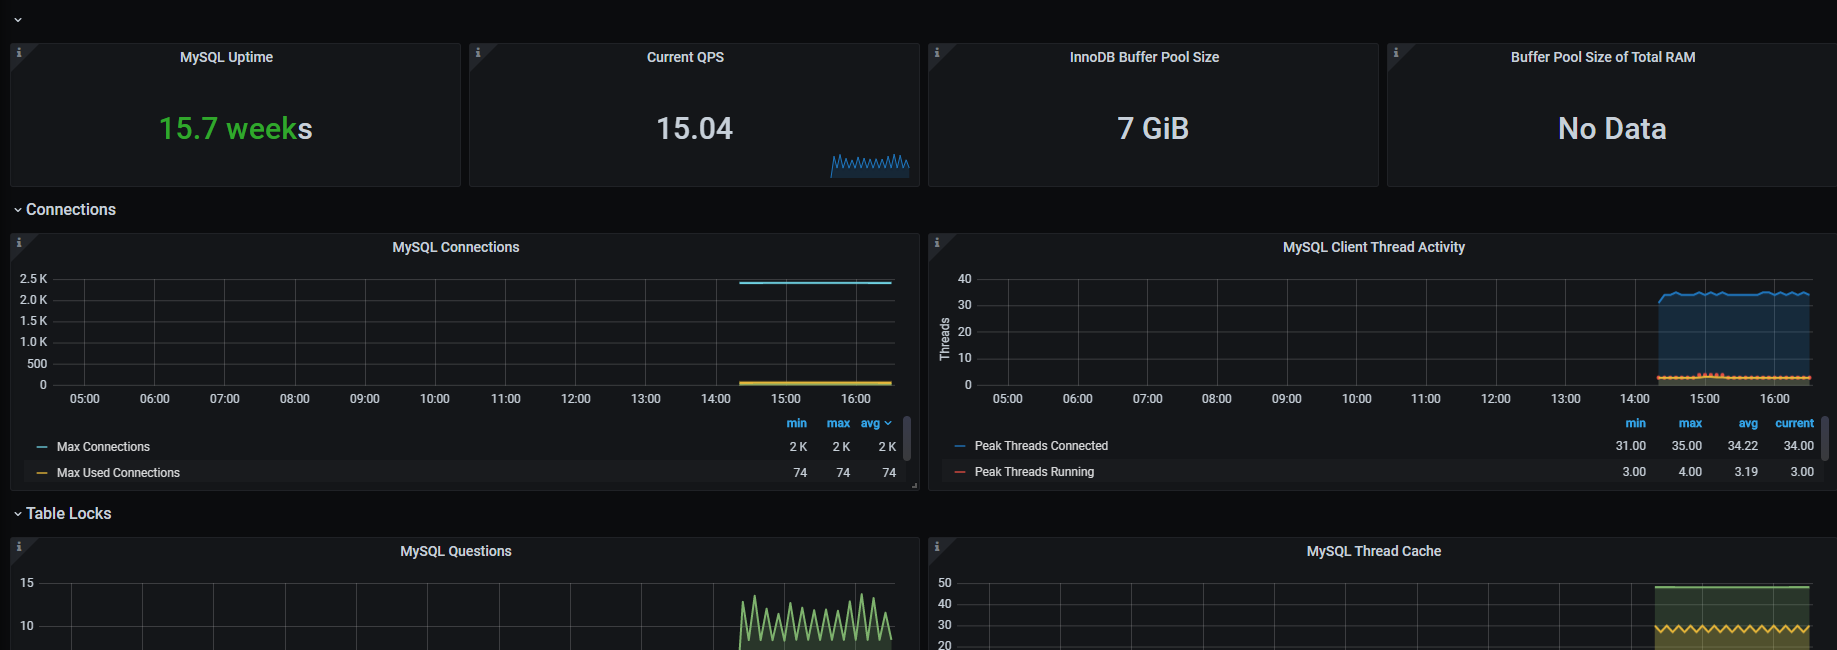
查看图表