Prometheus: Grafana 监控 Node Exporter 主机
字数:
138
·
阅读:
1 分钟
·
访问:
-
node_exporter 安装
监控远程 linux 服务器CPU、内存、磁盘、I/O等信息
下载慢,请查看软件下载列表
https://prometheus.io/download/
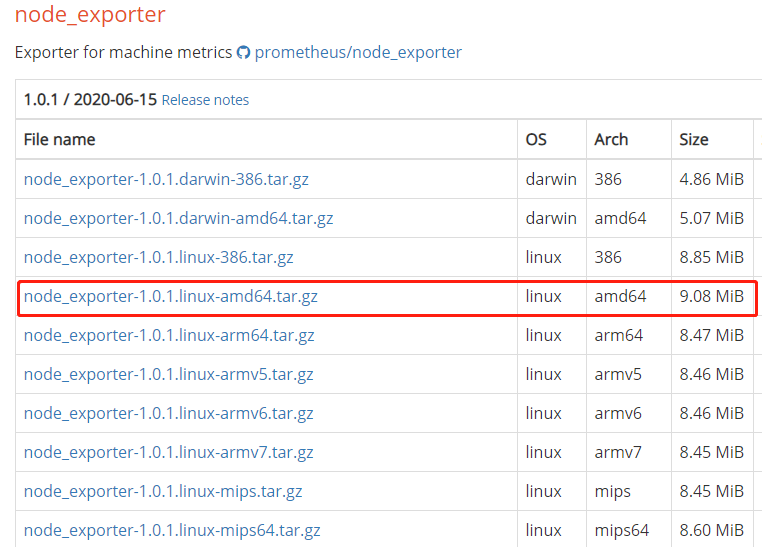
cd /usr/local/src
wget https://github.com/prometheus/node_exporter/releases/download/v1.0.1/node_exporter-1.0.1.linux-amd64.tar.gz
tar -zxvf node_exporter-1.0.1.linux-amd64.tar.gz -C /usr/local/
cd /usr/local/
mv node_exporter-1.0.1.linux-amd64 node_exporter
cd node_exporter
运行
先创建 systemd 服务
cat > /usr/lib/systemd/system/node_exporter.service << EOF
[Unit]
Description=node_exporter
Documentation=https://prometheus.io/
After=network.target

[Service]
Type=simple
User=root
ExecStart=/usr/local/node_exporter/node_exporter
KillMode=process
Restart=on-failure
RestartSec=10s

[Install]
WantedBy=multi-user.target
EOF
刷新 systemd && 运行 && 查看
systemctl daemon-reload # 刷新 systemd 配置
systemctl enable node_exporter # 加入开机启动
systemctl start node_exporter # 启动服务
systemctl status node_exporter # 查看详情
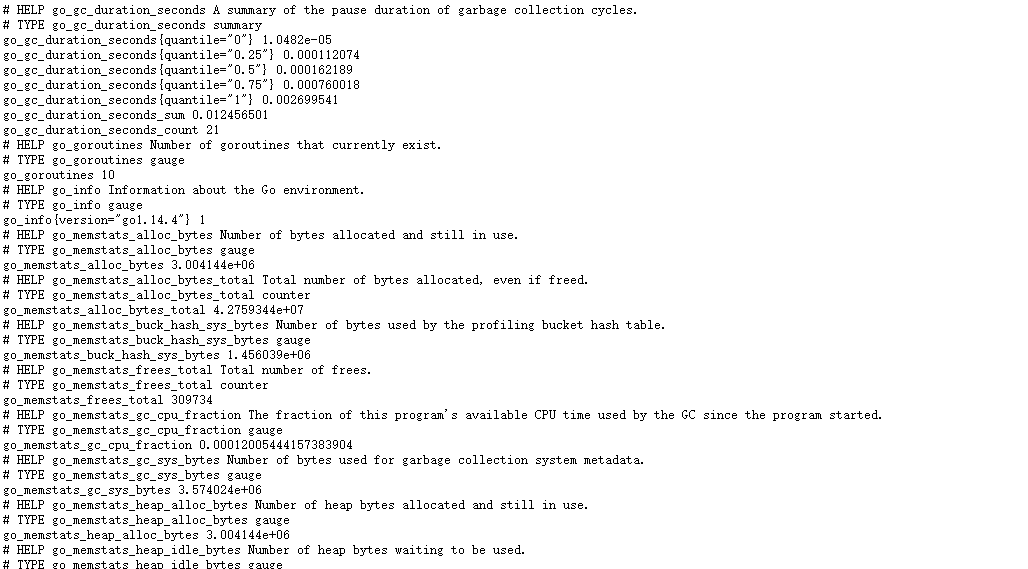
预览
http://192.168.61.66:9100/metrics
添加监控节点
添加 node_exporter
vim /usr/local/prometheus/prometheus.yml
# 在最后一个节点 scrape_configs 下添加  job_name
# 空2个空格

- job_name: 'node'  # 一定要全局唯一, 采集本机的 metrics,需要在本机安装 node_exporter
    scrape_interval: 10s # 采集的间隔时间
    static_configs:
      - targets: ['localhost:9100']  # 本机 node_exporter 的 endpoint

重启服务
systemctl restart prometheus
docker 安装
docker run -d -p 9100:9100 \
  -v "/proc:/host/proc:ro" \
  -v "/sys:/host/sys:ro" \
  -v "/:/rootfs:ro" \
  --net="host" \
  prom/node-exporter
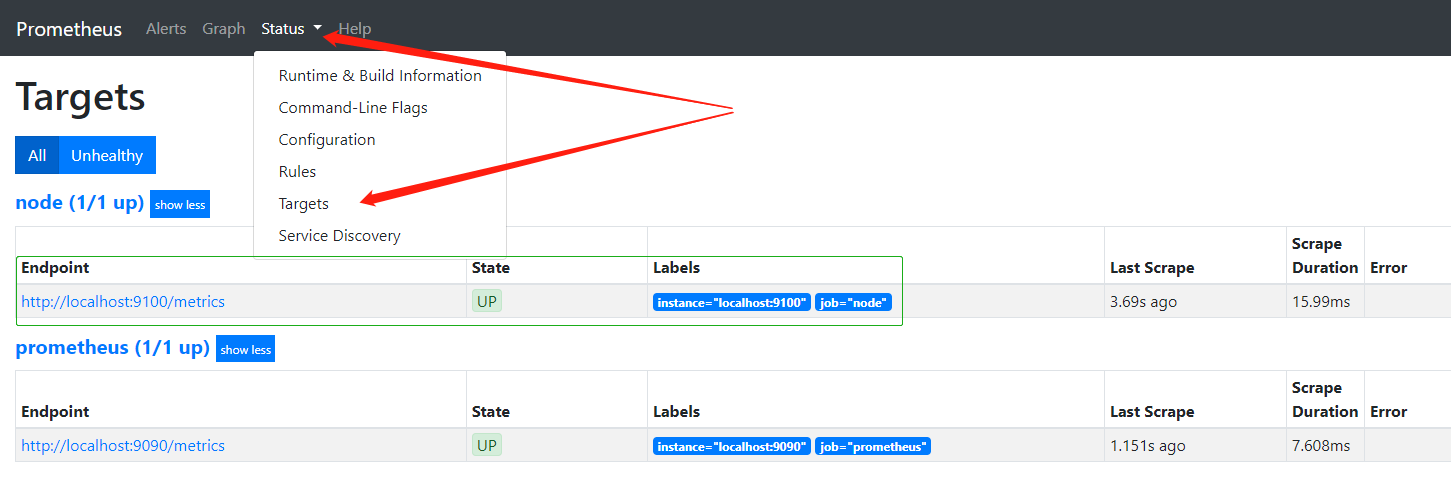
验证
浏览器上查看添加是否成功
http://192.168.61.66:9090/targets
关于我
我的博客:https://yezihack.github.io
欢迎关注我的微信公众号【空树之空】,共同学习,一起进步~