pprof火焰图性能分析利器之入门
前言
如果你的应用是一直运行的,比如 web 应用,那么可以使用
net/http/pprof库,它能够在提供 HTTP 服务进行分析。而非一直运行的程序可以使用 runtime/pprof 库
可以先看下pprof入门
go1.10自带 go tool pprof工具
go version 查看golang版本
安装
引用包_ "net/http/pprof"
内置包的路径: net\http\pprof\pprof.go
const (
	PProfPort = 6060 // 端口
)
func PprofServer() {
	runtime.SetMutexProfileFraction(1) // 开启对锁调用的跟踪
	runtime.SetBlockProfileRate(1)     // 开启对阻塞操作的跟踪
	go func() {
		err := http.ListenAndServe(fmt.Sprintf(":%d", PProfPort), nil)
		if err != nil {
			zlog.Warn().Err(err).Msg("BootPprof")
		}
	}()
}

func main() {
	PprofServer()
	select{}
}
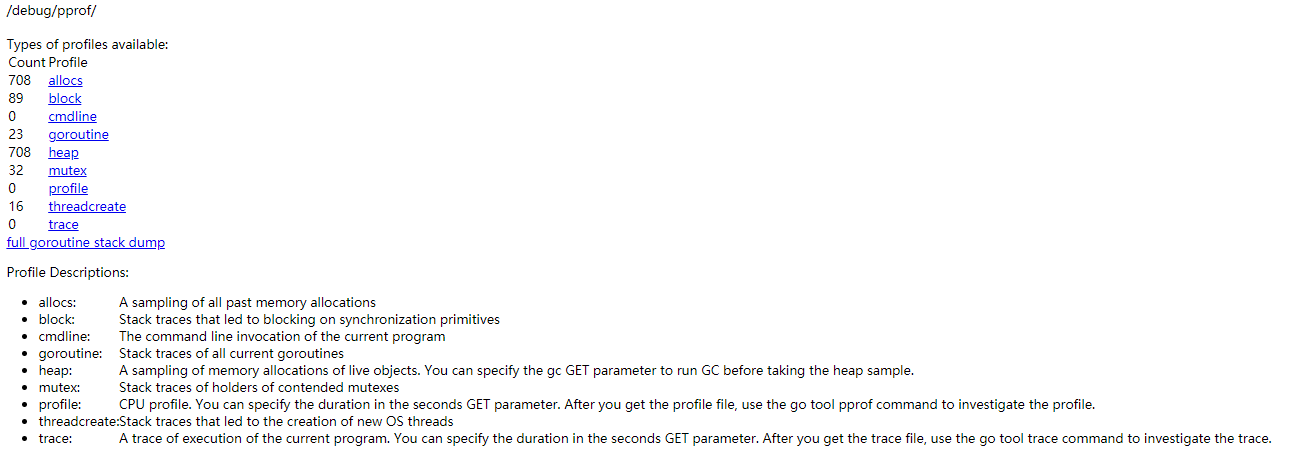
浏览器查看
- allocs 查看内存分配详情
- block 同步原语阻塞的堆栈跟踪
- cmdline 当前程序运行的参数
- goroutine 所有当前goroutines的堆栈跟踪
- heap 活动对象的内存分配的抽样
- mutex 争用互斥锁的持有者的堆栈跟踪
- profile CPU配置文件, 还可以使用go tool pprof 查看某时间段的cpu情况, 并生成火焰图
go tool pprof http://localhost:6060/debug/pprof/profile?seconds=30
- threadcreate.Stack 导致创建新的OS线程的跟踪
- trace 当前程序执行的轨迹
wget http://localhost:6060/debug/pprof/trace?seconds=5
http://127.0.01:8080/debug/pprof/
命令行使用
新建Makefile文件
touch Makefile
- profile 分析cpu的使用情况
- allocs 内容的使用情况
- goroutine 协和的使用情况
- mutex 锁的情况
- block 阻塞的情况
#!/bin/bash
PPort=6060
profile:
	go tool pprof http://localhost:${PPort}/debug/pprof/profile
heap:
	go tool pprof http://localhost:${PPort}/debug/pprof/heap
allocs:
	go tool pprof http://localhost:${PPort}/debug/pprof/allocs
goroutine:
	go tool pprof http://localhost:${PPort}/debug/pprof/goroutine
mutex:
	go tool pprof http://localhost:${PPort}/debug/pprof/mutex
block:
	go tool pprof http://localhost:${PPort}/debug/pprof/block
例: make profile 进行命令行.
profile默认30s用于采集数据, 也可以自定义,添加?second=60秒.然后进入了一个交互式命令行.可以对解析的结果进行查看和导出.也可以通过help查看更多的命令.
会自动在/root/pprof目录下生成一个分析结果的文件.可以使用go tool pprof -http=:6006 file 进行查看火焰图. 具体向下看.
常用命令
- top 显示最高占比
- tree 性能分析占用比较函数
- png 生成png图片,显示性能分析详情
- list ttp 对ttp函数名称进行分析
安装 Graphviz
Graphviz就画图工具,分析报告图与火焰图都依赖此工具.
window 安装
https://graphviz.org/_pages/Download/Download_windows.html
- 选择mis安装, 一直下一步即可.注意安装的目录
- 一般在:
C:\Program Files (x86)\Graphviz2.38\bin - 将bin目录添加到path环境变量里.
linux安装
ubuntu: apt-get install -y graphviz
centos: yum install -y graphviz
火焰图
我们可以进入/root/pprof目录下,
- go tool pprof -http=:6060 file 开启web浏览查看火焰图.
- go tool pprof -web file 弹出浏览器显示svg图片
- go tool pprof file 直接进入交互命令行模式
获取最近10秒程序运行的cpuprofile,-seconds参数不填默认为30
go tool pprof http://127.0.0.1:6060/debug/pprof/profile?seconds=10
10秒后会在root/pprof文件夹下生成一个类似这样的文件:
Saved profile in /root/pprof/pprof.samples.cpu.007.pb.gz
然后使用: go tool pprof -http=0.0.0.0:6061 /root/pprof/pprof.samples.cpu.007.pb.gz`
然后浏览器上: http://127.0.0.1:6061
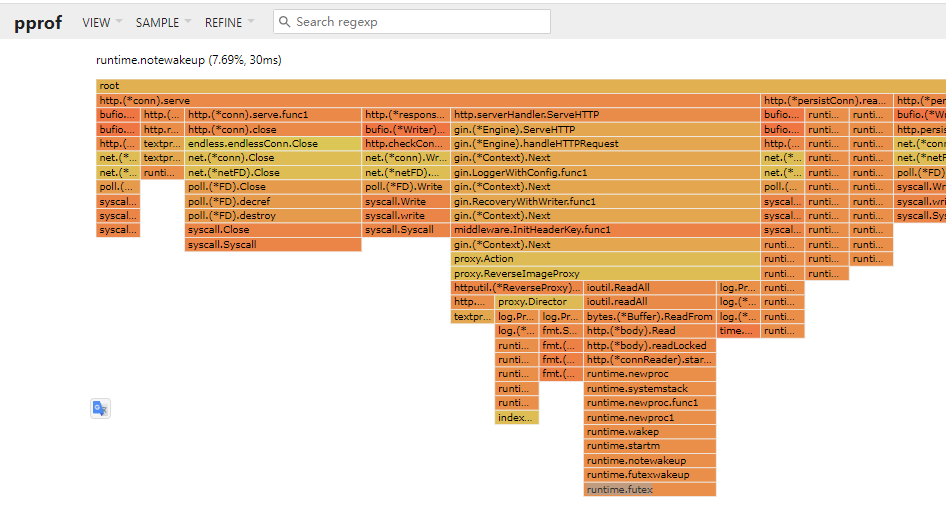
图中,从上往下是方法的调用栈,长度代表cpu时长。
参考
- https://zhuanlan.zhihu.com/p/71529062
- https://gocn.vip/topics/10521
- https://www.cnblogs.com/linguoguo/p/10375224.html
- https://github.com/google/pprof/
- 官方文档